Research & Design
Advisory Job Mapping
Sharpening product strategy through jobs-to-be-done remapping
Overview
Prior Jobs-to-be-Done (JTBD) studies had comprehensively mapped the advisory workflow. Over the years since the original studies, the jobs themselves hadn't changed, but with AI and emerging technologies reshaping what's solvable, problems we once deprioritized were suddenly within reach.
This study wasn't about redefining the landscape. It was about sharpening our lens — layering internal domain expertise onto industry-level opportunity data to surface the problems most worth solving and aligning them against the current product roadmap.
The Challenge
How might we identify the highest-impact advisory problems worth solving now given that our capabilities have evolved but our roadmap hasn't fully caught up?
Two foundational studies — a Small Business Owner JTBD and a Multi-Service Firm JTBD — had produced over 100 jobs spanning the advisory space. The data was rich but sprawling. We needed a way to distill it into something actionable: a prioritized view that reflected both what customers need and what our product can now deliver.
Methodology
The approach was deliberately layered. We started with the objective, industry-level job priority data from existing research and voice-of-customer signals, then overlaid a subjective, internal lens drawn from our collective knowledge of the customer experience and ITA's current capabilities.
Restructured prior JTBD data from two foundational studies (SBO & MSF) into a unified framework
Conducted an internal coding exercise — team scored each job on importance, satisfaction, and evidence
Analyzed for variance across scorers to identify areas of disagreement
Ran calibration sessions to discuss misalignment and reach consensus
Layered adjusted internal scores onto objective, industry-level opportunity scores
Produced an evenly weighted consolidated view for balanced prioritization
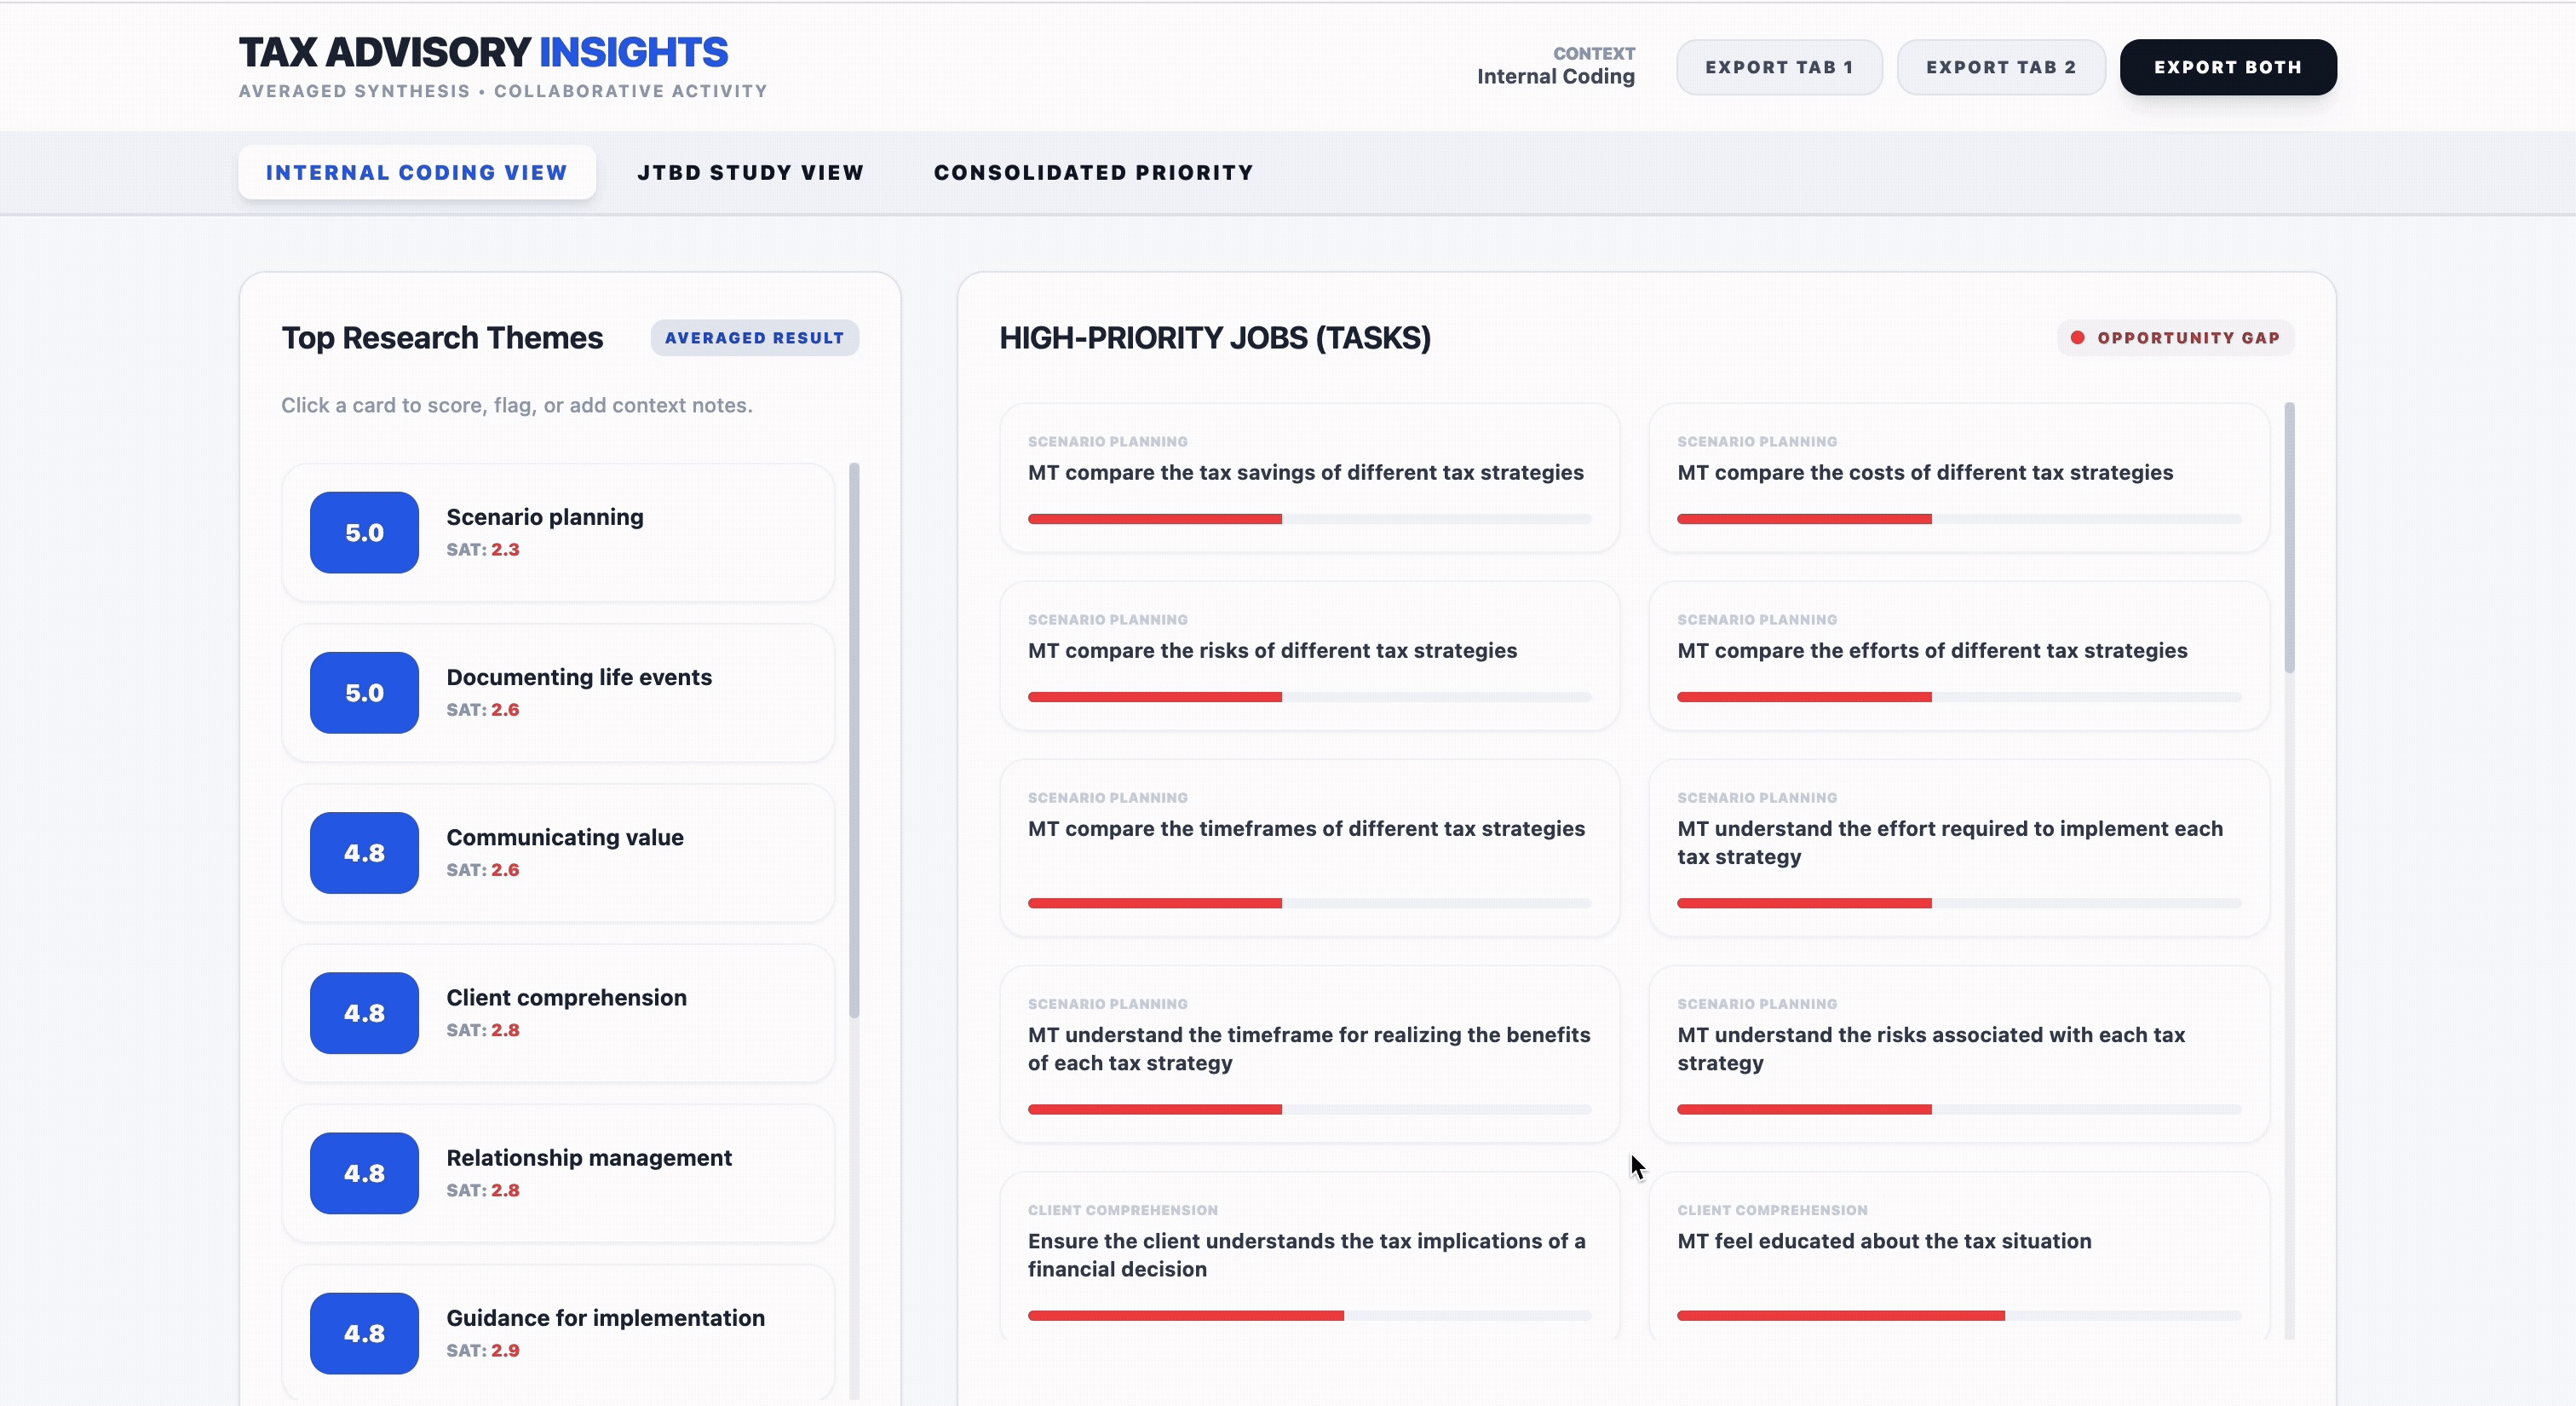
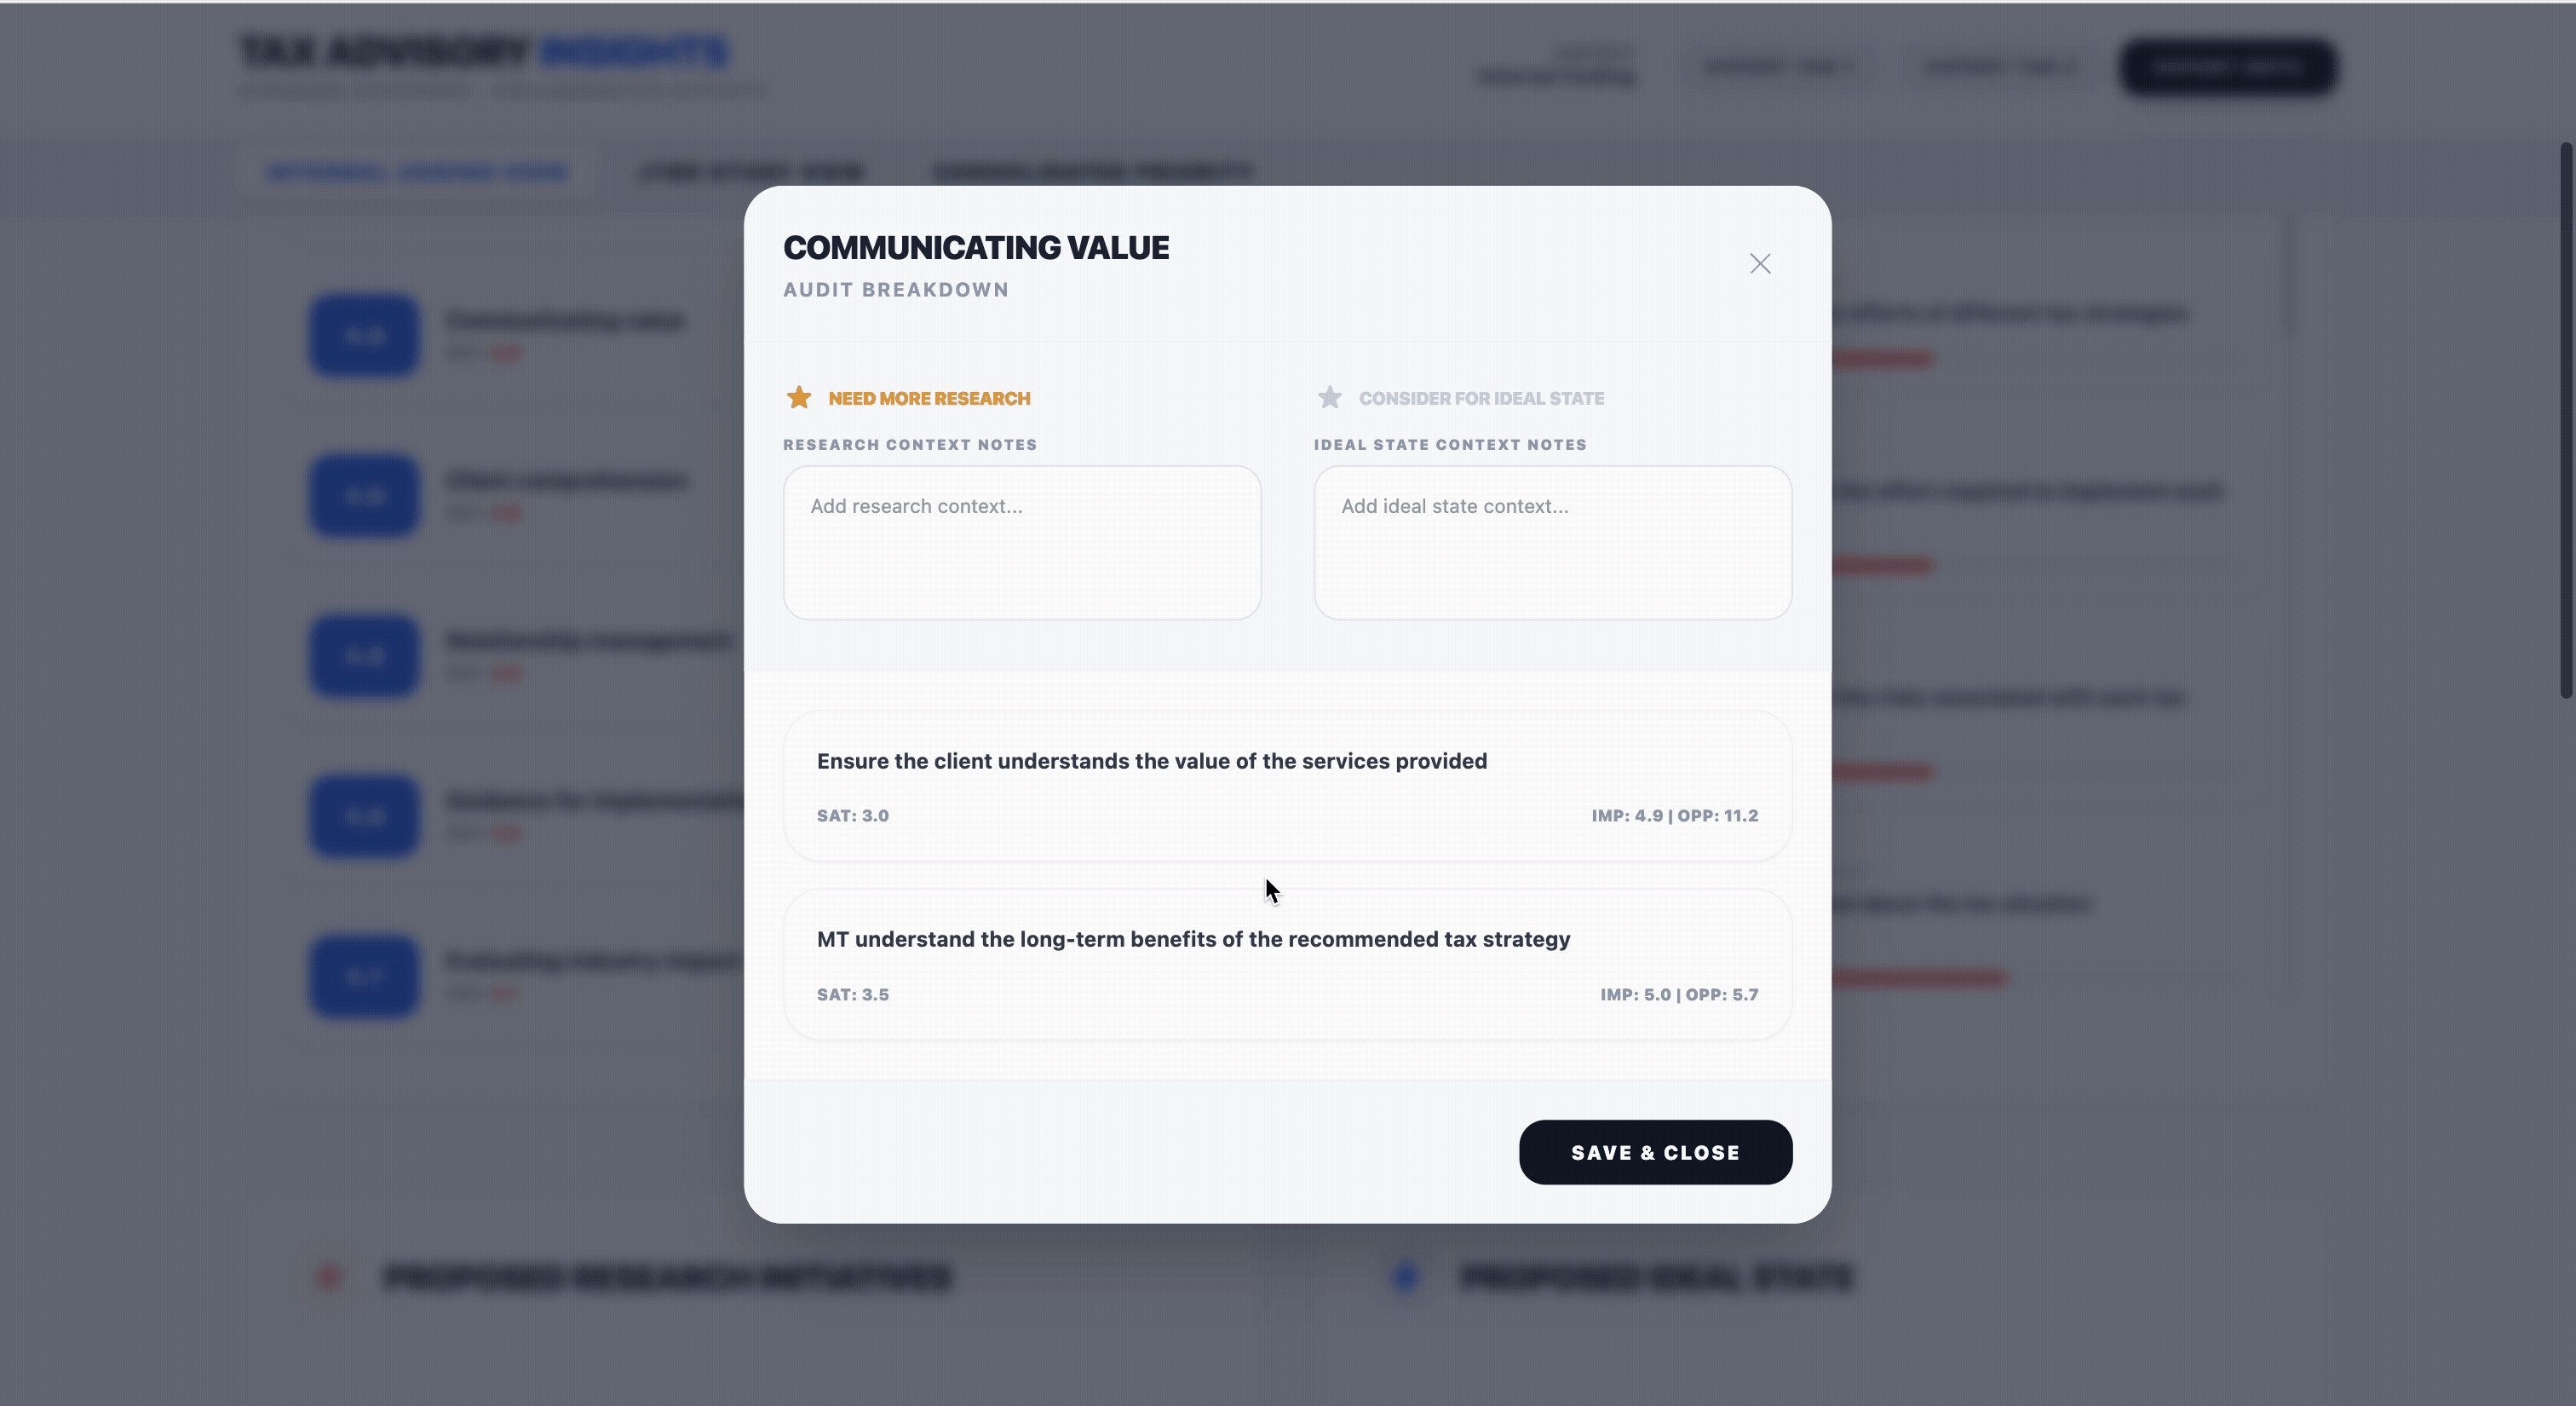
Design: The Dashboard
Raw spreadsheets weren't enough. The data needed to be navigable, comparative, and collaborative — optimized for the kind of cross-functional conversations that would shape the roadmap.
Using Figma and Gemini, I ideated, planned, and designed a GitHub-based dashboard for real-time collaborative analysis. The design process started with understanding where raw sheets fell short, then mapping the decision flow stakeholders would follow, and finally determining how the data should be visualized to surface patterns and gaps at a glance.

The result was a tool that made it easy to explicitly compare surfaced themes against the current roadmap — identifying where confidence was high and where priority might need to shift.
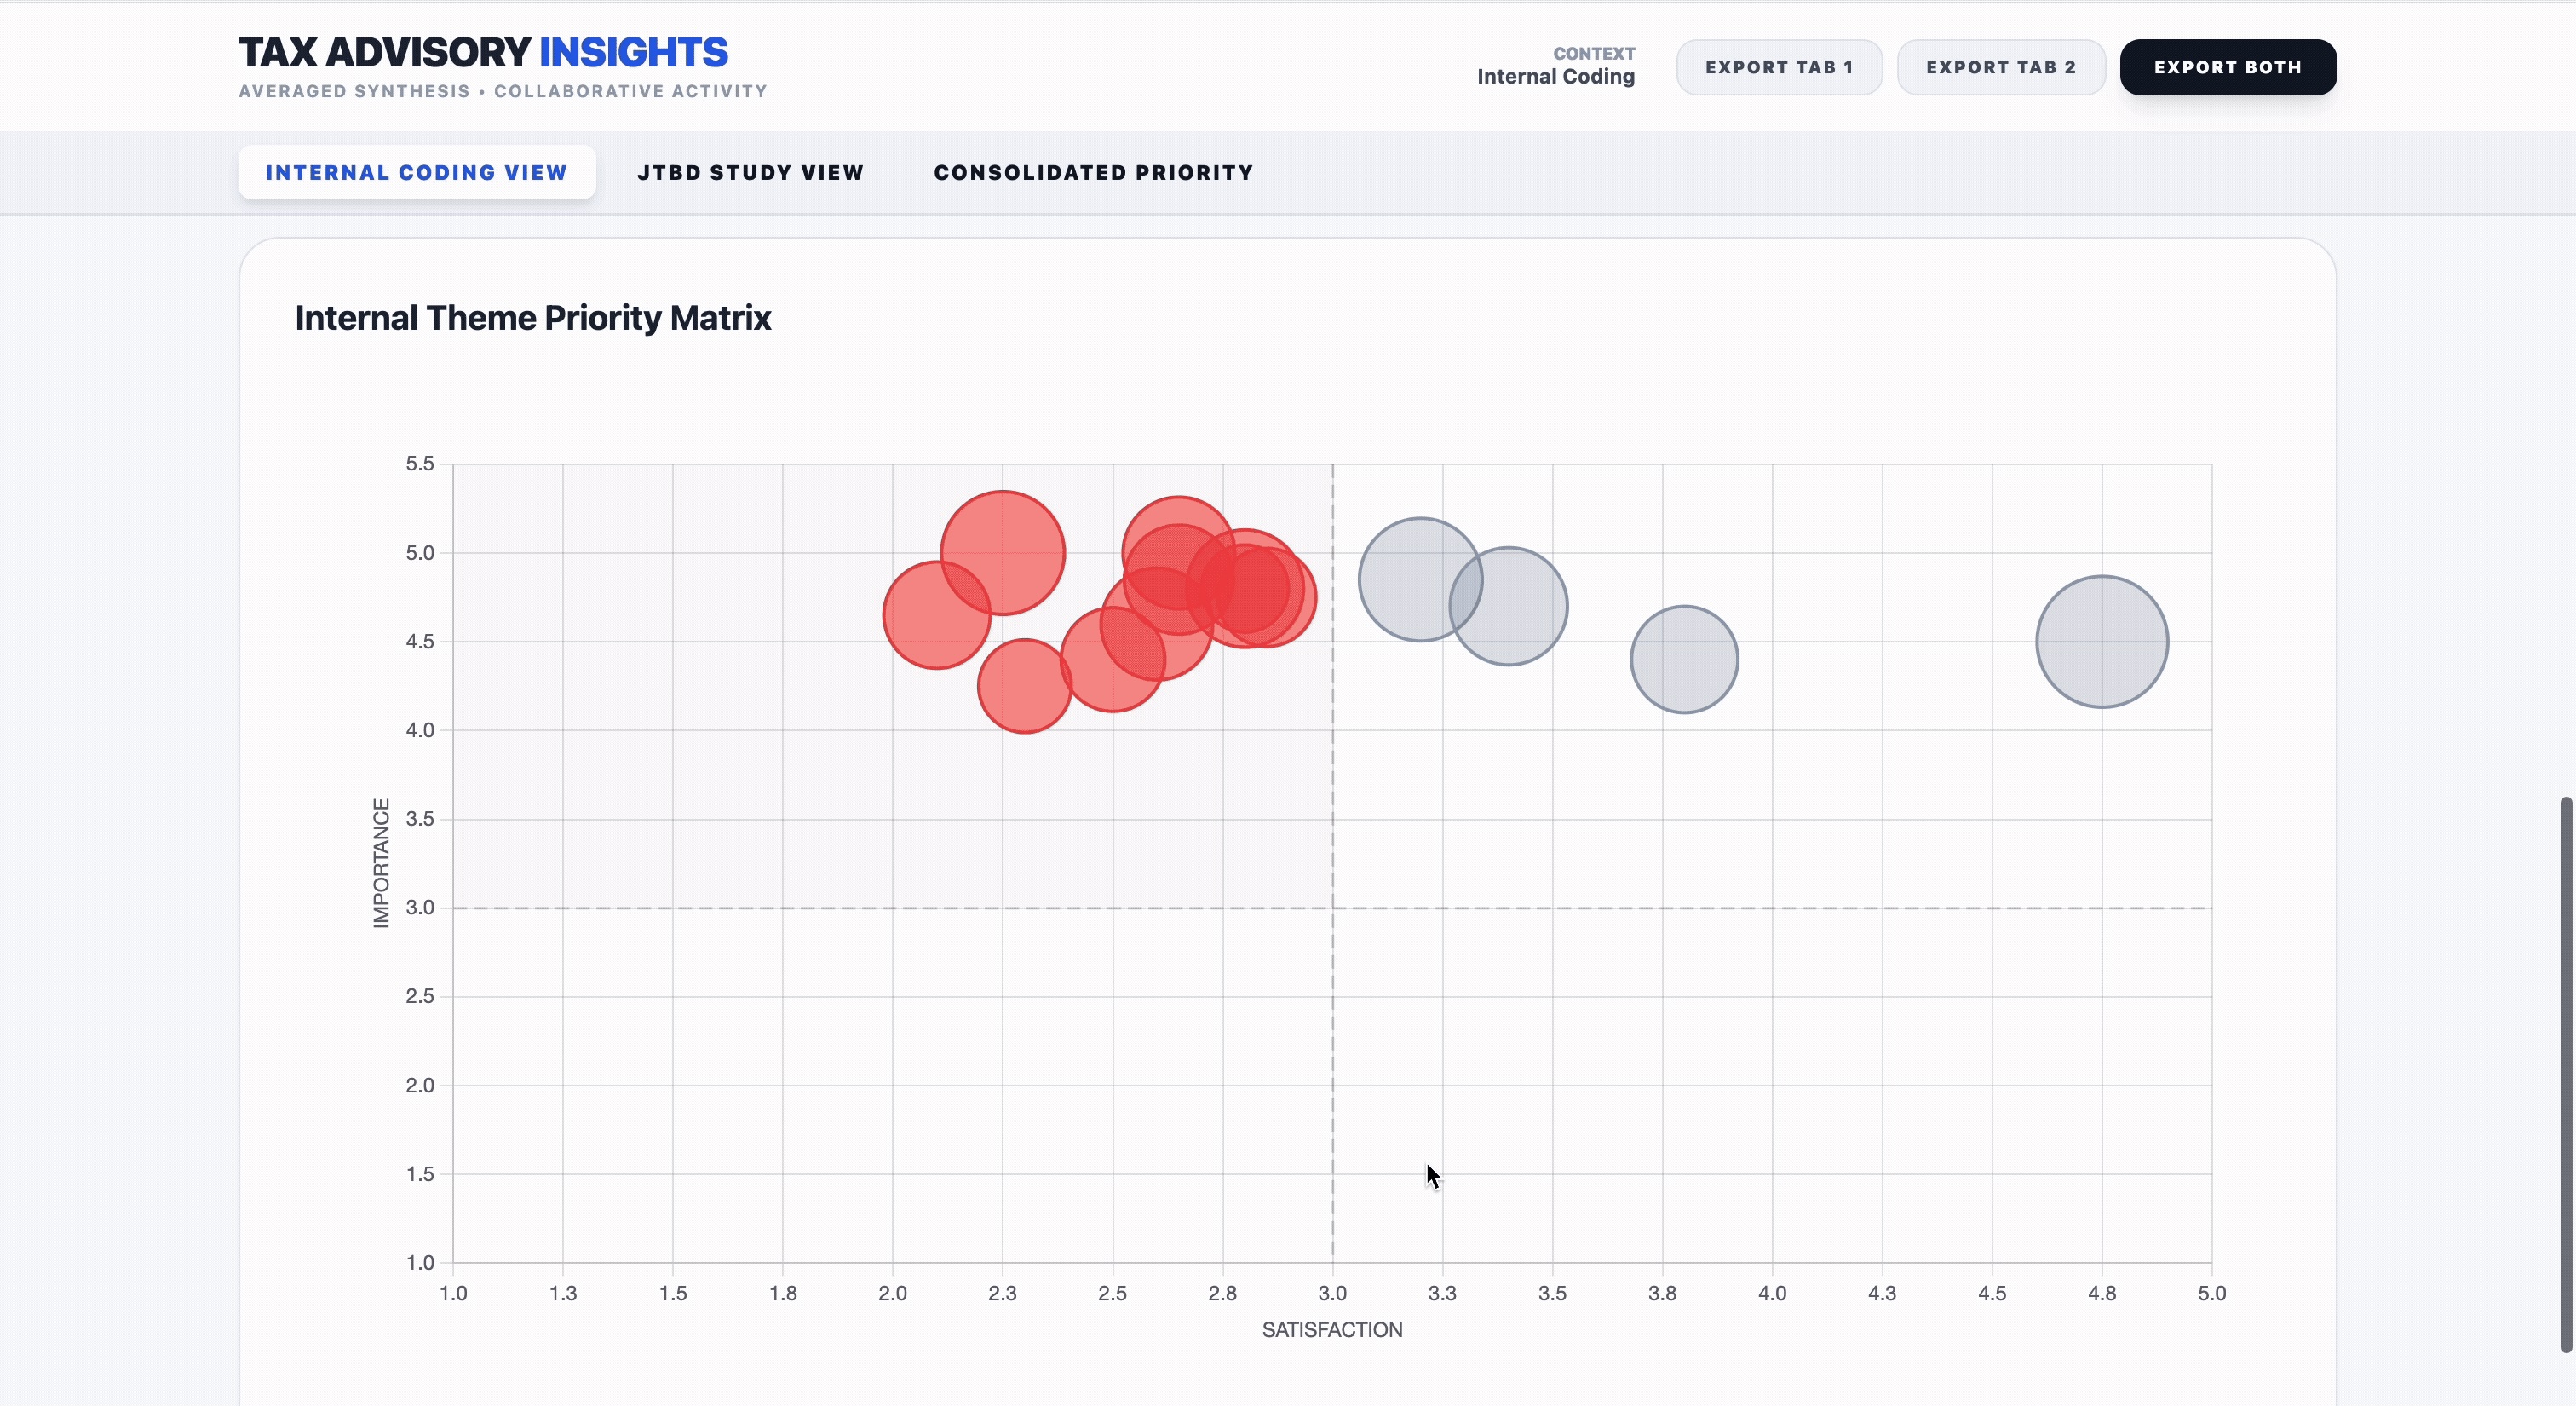
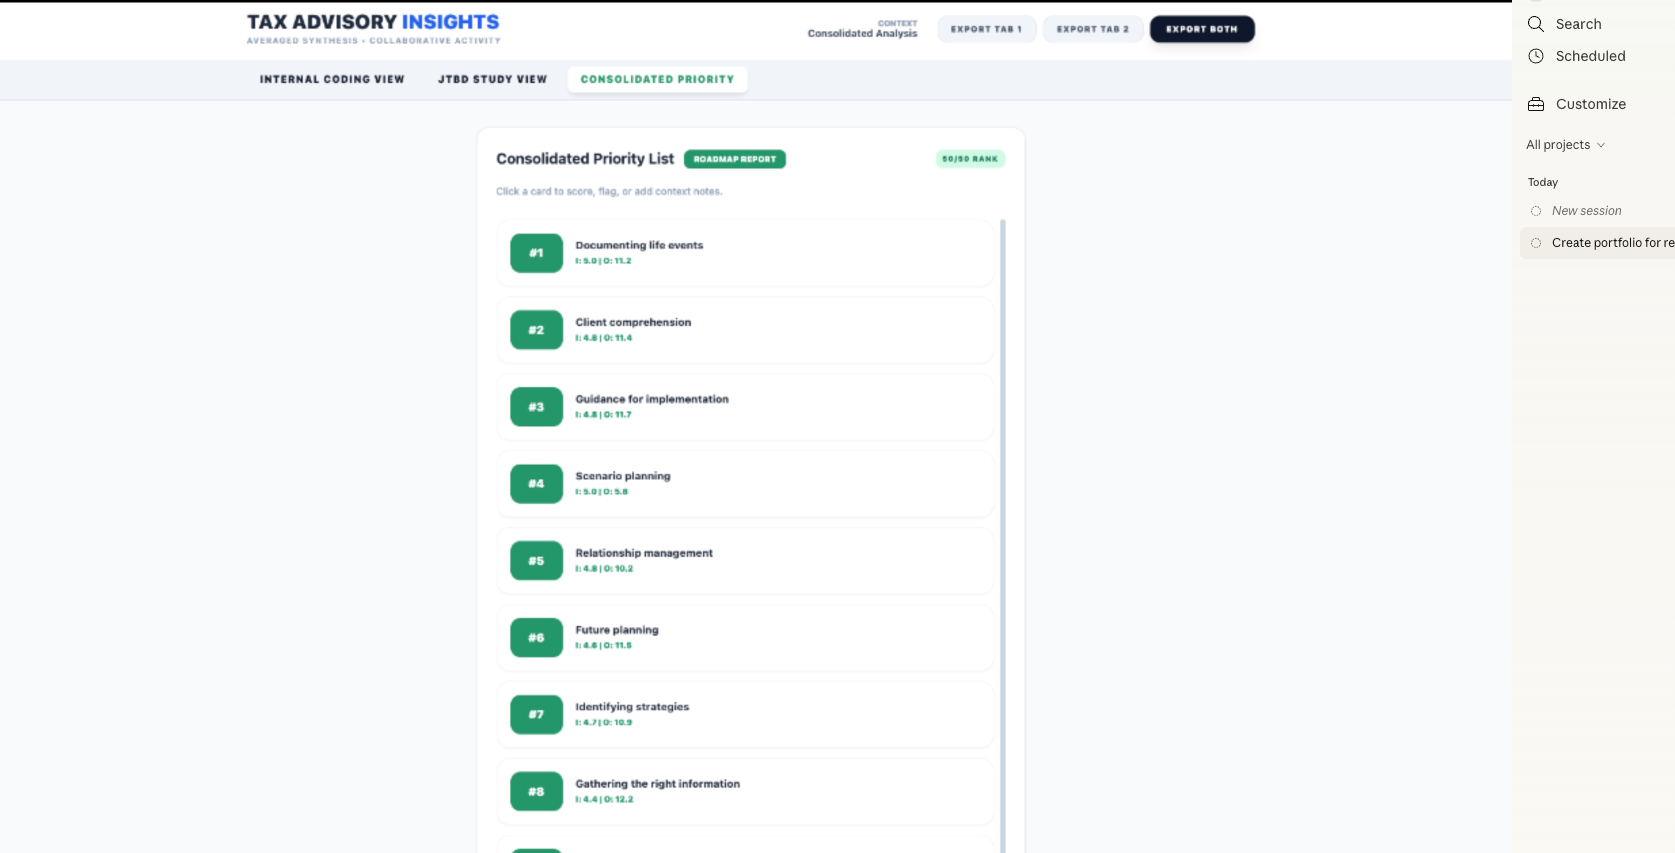
Key Findings
Three themes emerged as critically underrepresented in the current roadmap — areas where customer need was high but product investment hadn't kept pace.
01
Life Event Documentation
Effectively capturing and organizing the "right" information about clients' changing circumstances.
02
Client Comprehension
Proactively accounting for how well clients actually understand advisory guidance and its value.
03
Scenario Planning
Incorporating forward-looking scenario planning as a core function of the advisory experience.
These gaps weren't theoretical. Through prior studies such as recently conducted ethnographic sessions, we observed that a large segment of high-operating customers had built their own proprietary tools to serve as workarounds for the very problems our data had surfaced, further validating our findings.
Impact & Next Steps
The consolidated prioritization view gave the team a shared language for strategic conversations. Where surfaced themes overlapped with the existing roadmap, we had high confidence and could move faster. Where they didn't — that became a conversation about whether priority needed to shift.
What came next:
- Prioritized research projects targeting the highlighted gap areas
- Incorporated themes into ITA's 1-N prioritization framework
- Surfaced relevant features in the product roadmap based on evidence level
Reflections
Balancing subjective expertise with objective data required discipline. It would have been easy to let internal intuition override the numbers, or to defer entirely to industry scores that lacked our contextual knowledge. The even weighting kept both lenses honest — and the calibration sessions kept us honest with each other.
This project reinforced something I believe deeply: the value of research isn't just in the findings — it's in making those findings workable. A spreadsheet of 100+ prioritized jobs is only useful if the team can navigate it, debate it, and act on it together.